
Guest Post: Brian Hurler (USAV Women) – How Set Speeds Affect Hitting Efficiency
Brian Hurler is currently the Performance Analyst for the USA Beach National Teams. Brian was most recently the Performance Analyst for Karch Kiraly and the USA Women's National Team. Before that he held the position of Technical Coordinator at Stanford University and held a similar position at Creighton University when he wrote this in 2020. Not a terrible trajectory for the guy huh? (https://usavolleyball.org/story/hurler-bringing-talents-to-u-s-womens-nt-staff/)
Outside Set Speeds Per Team
Using match data from the 2019 fall season, I took a sample of set speeds for the seven teams who have made the Elite Eight the most since 2015, plus Creighton. The speeds were measured using the open source time extension for VLC Media Player – which can be found here (https://addons.videolan.org/p/1154032/).
Below is a comparison of how fast each team set based on different pass ratings. Stanford and Minnesota set the quickest of the teams surveyed, while Nebraska and Creighton set the slowest. This was true regardless of the quality of the pass. When the pass was perfect, Stanford and Minnesota set below 1.0 seconds over 70% of the time, while the rest of the teams set below 1.0 seconds 30% of the time or less, ending with Nebraska at 0%. Even when the pass was medium or bad, Stanford and Minnesota still set below 1.0 seconds almost 50% of the time.

Consistency
Here’s where things get a little more interesting, these graphs show the range of different speeds that each team has set at. When a range is smaller, it indicates that a team is consistent with their set tempo, either intentionally trying to keep the same tempo from all types of passes, or they just happen to have a good, consistent setter.

When considering all passes, Stanford and Nebraska have the most consistent set tempos. This is actually striking, one could argue that these two programs have had the most success in recent years based on their NCAA Tournament results but have opposite speeds in this survey (Nebraska – slowest, Stanford – fastest), however they both share consistency in common.
This adds weight to the argument that a consistent setter is nearly as important as setter who can set fast, if not just as important, especially as speed increases and hitters are dependent on the set being in the location they are expecting it to be – which is a result of them expecting the ball to travel at that same speed every time. Hitters can make adjustments to their approach based on the setter and her location on the court, but in a fast offense once the ball leaves the setter’s hands hitters need to have made a decision to approach and are then relying on set speed consistency. In comparison, Minnesota, Texas, and Creighton have the largest ranges.

Creighton’s consistency dramatically increases when looking at just good and perfect passes, here it rivaled Stanford and Nebraska. Minnesota and Texas still have a large range.

Stanford is the biggest outlier here, setting consistently fast even when passes are off the net.
Hitting Efficiency vs. Set Speed
The points below represent each team’s average set speed and their hitting efficiency. There is a loose correlation between set speed and hitting efficiency. In layman’s terms, teams who set their outsides faster had a higher hitting efficiency. These charts do not mean that faster sets are causing a higher hitting efficiency, it just means that we can see a loose relationship between the two. Other factors (height, jump height, physicality, whether or not a team can execute a fast set, etc) are considerations.
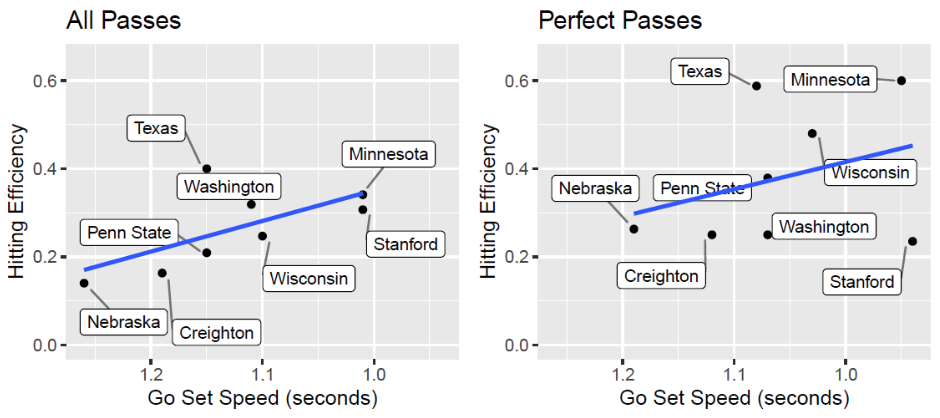
All Passes – Looking at the first graph of all passes, teams who set their outsides faster had higher hitting efficiencies. The outlier is Texas, who set at the same pace as Penn State, slower than Washington, Wisconsin, Minnesota, and Stanford, but still hit .400.
Perfect Passes – Surprisingly, this graph showed the worst correlation between speed and efficiency. Faster sets were loosely related to higher hitting efficiencies, but Stanford’s speed was very fast with a poor efficiency and Texas was moderately paced with an extremely high efficiency. My initial assumption is that the middle attacker becomes an increasingly important focus for defenses facing a perfect pass situation, and the amount of focus they put on the middle attacker will change the outside attacker’s ability to score, allowing for slower sets to still lead to high efficiencies. The true exception is Stanford, who did not hit well on perfect passes in the sampled data.

Good and Other Passes – Both of these graphs show a general trend of faster sets and higher hitting efficiency being related, particularly the Other Passes graph, which is when the middle attacker is not a viable option. One theory is that a faster set is even MORE important when the setter is off the net because the middle blockers may be cheating over to block the outside, and a faster set could help outside attackers target the hole or attack hands on blocks that are not all the way up.
Hitting Efficiencies Per Team at Different Speeds (All Passes)
Each graph represents a team’s entire sample of sets broken into thirds (slowest third, medium third, fastest third) and the hitting efficiency for each third.

Stanford, Nebraska, and Minnesota show an increasing hitting efficiency as sets get faster. Penn State basically also has this trend. The first assumption is that faster sets is giving their outsides a better shot at scoring against a late block or defender who is not balanced and ready, however another possibility could be that these setters are simply superior at ball placement, so even their faster sets are well placed, despite being quicker.

Wisconsin, Washington, and Texas’s charts are more unclear. They seem to be hitting the slower range and faster range balls well, but for all three teams the middle speed was their worst. One theory is that a slow, high ball gives the hitter time to read and make a good decision, and a fast set allows the hitter to beat the block or defenders, but a middle-paced ball allows for neither. Creighton’s efficiency decreased as the sets got faster, the only one of the eight teams surveyed.
Hitting Efficiencies Per Team at Different Speeds (Good and Perfect Passes)
Below is the same format, but only on good and perfect passes.

The same trend applies – Stanford, Minnesota, Penn State, and Nebraska are benefitting from their fastest sets more. Nebraska runs the slowest sets, and the hitting efficiencies reflect that. Variations in hitting efficiency could also be impacted by sample size.

Wisconsin and Washington saw some benefit from faster sets in good and perfect pass situations. Texas did not have a significant added benefit from faster sets in these situations. Creighton’s efficiency decreased as the sets got faster, the only one of the eight teams surveyed.